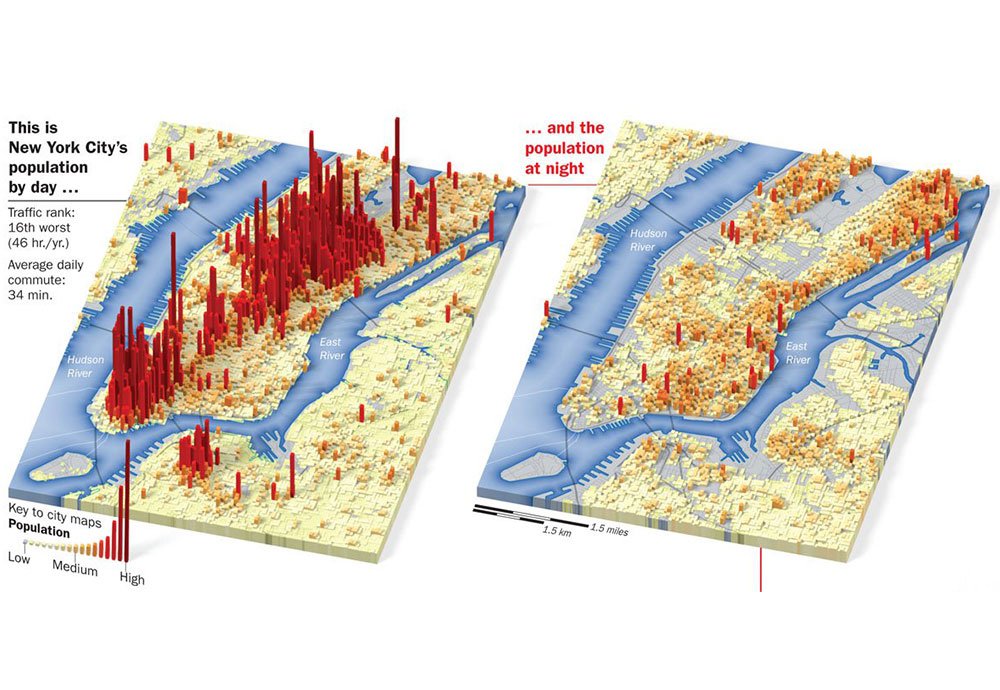
Despite our reputation for nocturnality, it turns out that New York City is actually far more alive during the daytime. In a striking infographic for Time Magazine, Joe Lertola set out to illustrate just how much Manhattan’s population swells throughout the dayand the results are staggering.
These side-by-side maps reveal the extent to which certain areas of Manhattan populate during the day, and, conversely, how that population depletes at night as commuters head back to their suburban and outer borough homes.
Perhaps not surprisingly, these maps illustrate particularly dramatic change in East Midtown, West Midtown, and the Financial District. More residential areas, meanwhile, like Williamsburg, the Upper West Side, and the East Village, remain more stagnant throughout the day. The map also features areas where the population actually increases at night-check out Yorkville and Roosevelt Island, neighborhoods almost strictly devoted to residential real estate.
Lertola collected the original data for the image in collaboration with LandScan U.S.A, a government-sponsored program founded by a geography-tech group at the Oak Ridge National Laboratory. By cross-referencing recent census data with a detailed analysis of urban labor figures and traffic, LandScan’s database can forecast the population of any Manhattan neighborhood at any time of day.
Lertola has also created similar maps for San Francisco, Chicago, and Washington D.C.


