August numbers show considerable differences from borough to borough, reflecting the changing real estate market as a result of Covid-19.
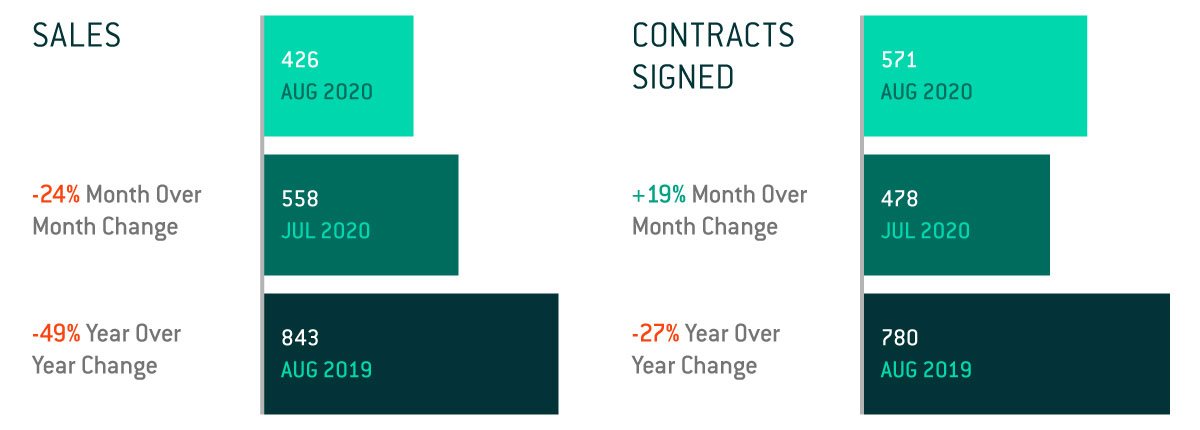
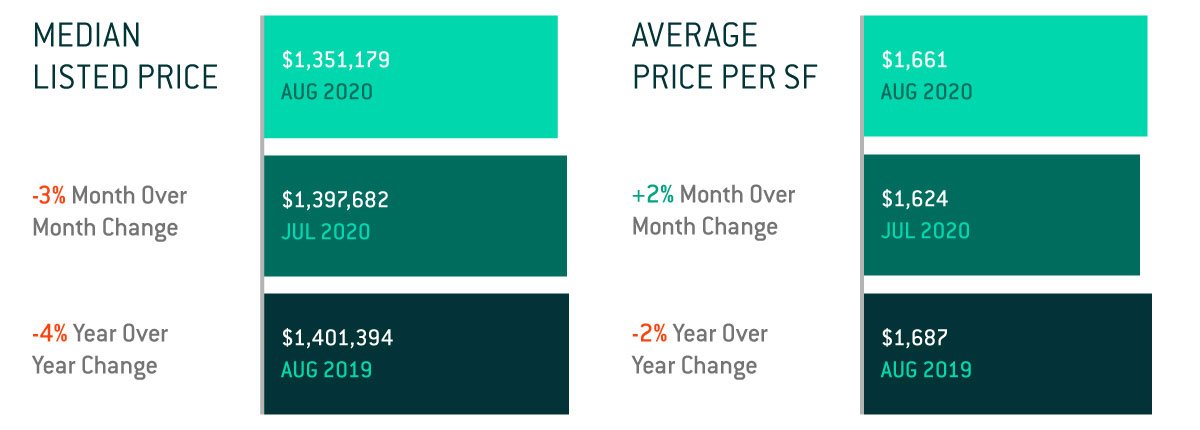
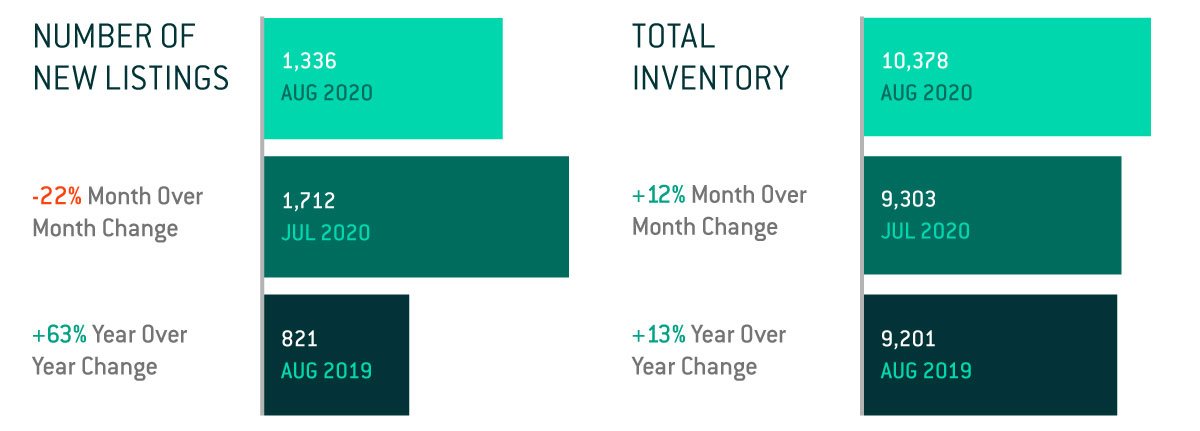
Year over year and month over month data indicates a strong buyer’s market in Manhattan. Prices are down, sales are down, year over year price per square foot is down, and there is more inventory than usual for this time of year. Relative to July, however, the August market saw a 19% increase in the number of contracts signed and a 2% increase in average price per square foot. Historically low interest rates complement the current buyer’s market for those seeking an opportunity to buy.

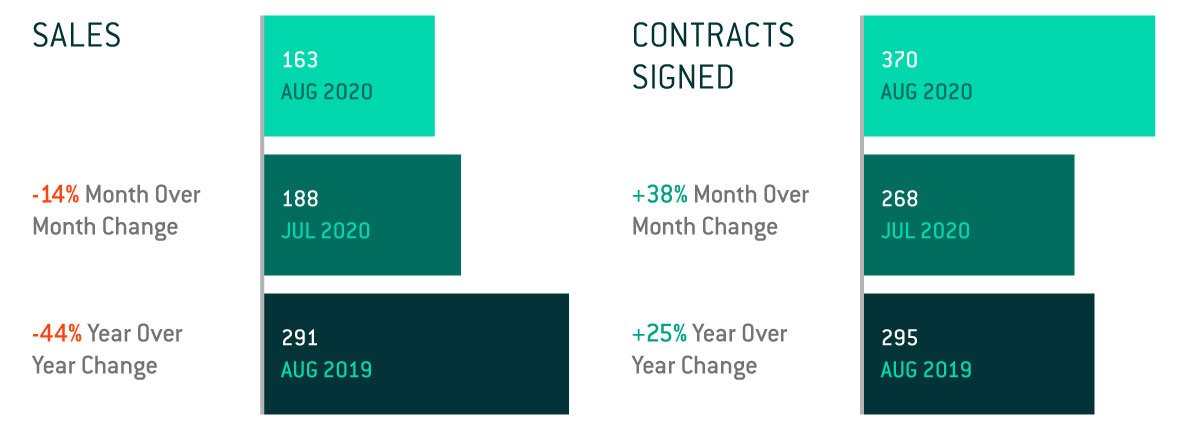
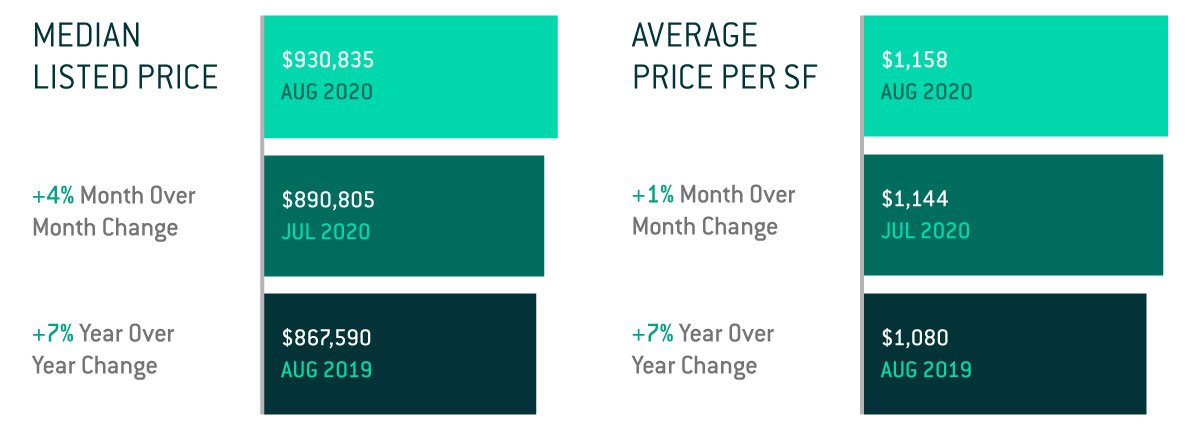
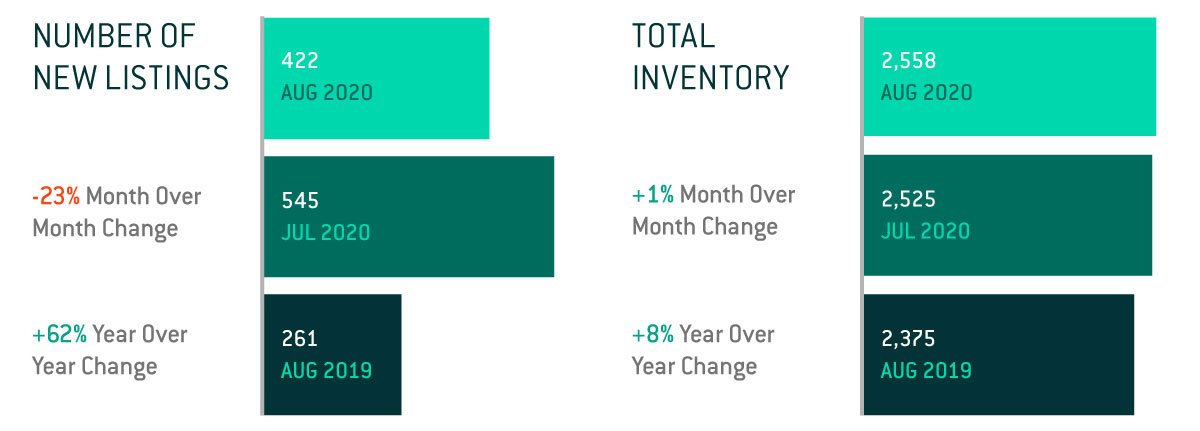
The Brooklyn market was hot in August. There was a 25% year over year increase in the number of contracts signed and a 7% year over year increase in both median listed price and average price per square foot. August saw 38% more contracts signed, 20% fewer listings with price drops, and a 4% increase in median listed prices compared with the previous month. Year over year sales remain down 44% and year over year inventory numbers are up 8%.

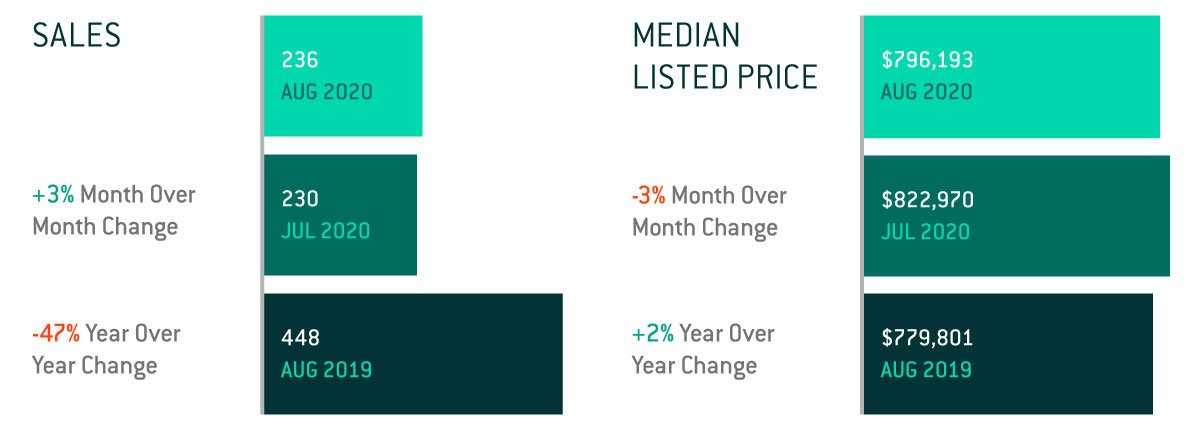
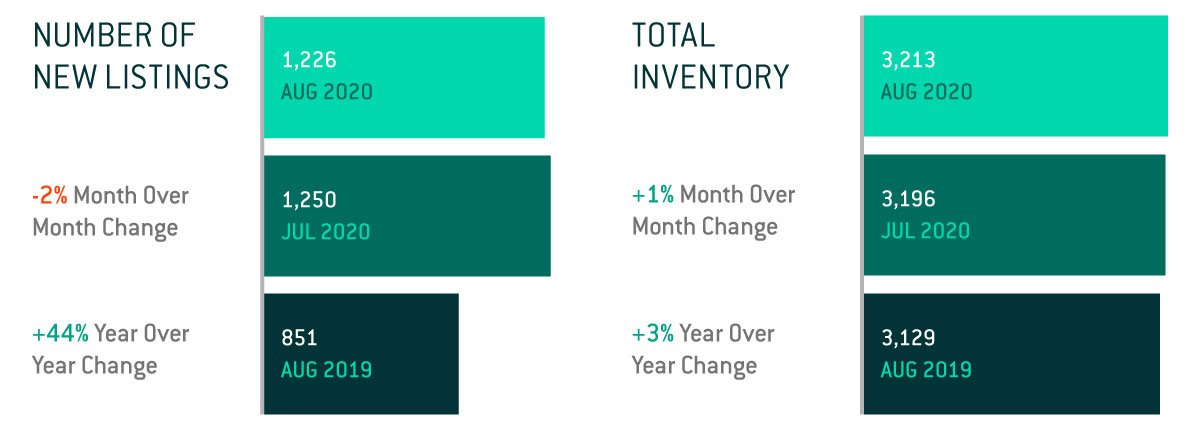
The Queens market in August held steady with a 2% year over year increase in median listed price and a 3% month over month increase in number of sales. Even though there were 44% more listings in August 2020 than there were in August 2019, total inventory for this time of year was up only 3%.

Figures in this report are based on publicly reported data from Automated City Register Information System (ACRIS) as well as proprietary data.


